Error tracking and incident response on production with Sentry + Squadcast + Linear + Slack

Table of Contents
There are multiple strategies to mitigate the number of bugs and problems with the app in production. Some teams focus on unit tests, functional tests, integration tests, manual tests, multiple environments to run those, and build the artifact of the app. Processes for reviewing code, static code analysis, CI/CD pipelines, and so on and so forth.
There are dozens of different approaches you can take, all of which depend on the project you’re building, the company’s budget, or people’s skills.
But regardless of your approach or skills, it is quite likely that sooner or later your application will face some problems. It could be an unhandled exception, a third-party API that is not working as it used to, or a bug in your app.
That’s why it is very important to:
Be aware of your platform’s health and react to incidents that occur, ideally before your users will notice, to maintain trust with them.
Alerting & Monitoring #
Just as with assuring the quality of your application, there are dozens of different ways to handle alerting and monitoring.
CloudWatch, PagerDuty, Datadog, New Relic, Sentry, just to name a few. There are dozens of possible configurations and combinations of tools.
Today, I would like to focus on three tools that, together or separately, can help you with Alerting & Monitoring.
Sentry, squadcast, slack, and Linear.
How to integrate Sentry + Squadcast + Slack + Linear #
All of these tools separately bring a lot of value to your project. However, the true power lies in integrating them together.
So, what really happened here?
- Your app (microservice, Docker container, frontend app, etc.) throws an exception.
- Sentry catches it and, based on the project’s alert rules, sends a notification about it to Slack and Linear.
- The Slack API receives an HTTP request and sends a message to the channel that your team follows, e.g.,
#alerts-production. - Linear creates a ticket from the Sentry issue in a separate team, e.g.,
issues:prod. - Squadcast is notified through a webhook about the new Linear ticket and creates an incident, triggering the configured escalation policy.
This way, we’ve connected four systems that will help you improve awareness of your platform’s health and, hopefully, maintain trust with your customers.
Let’s go through the specified components of this flow and their selected features and configuration. These can be useful during the process of setting up the whole flow.
Sentry #
Sentry is a great error tracker, but it offers more than that. It also provides profiling, replays of sessions that caused problems (on the frontend), cron monitoring, dashboards, alerting, and a few other features. These components are available for multiple languages and frameworks.
What we’re particularly interested in during this exercise are two components: error tracking and alerting.
Setting up alerts is very easy. You can find it in the “Alerts -> Create Alert” section. It should look similar to: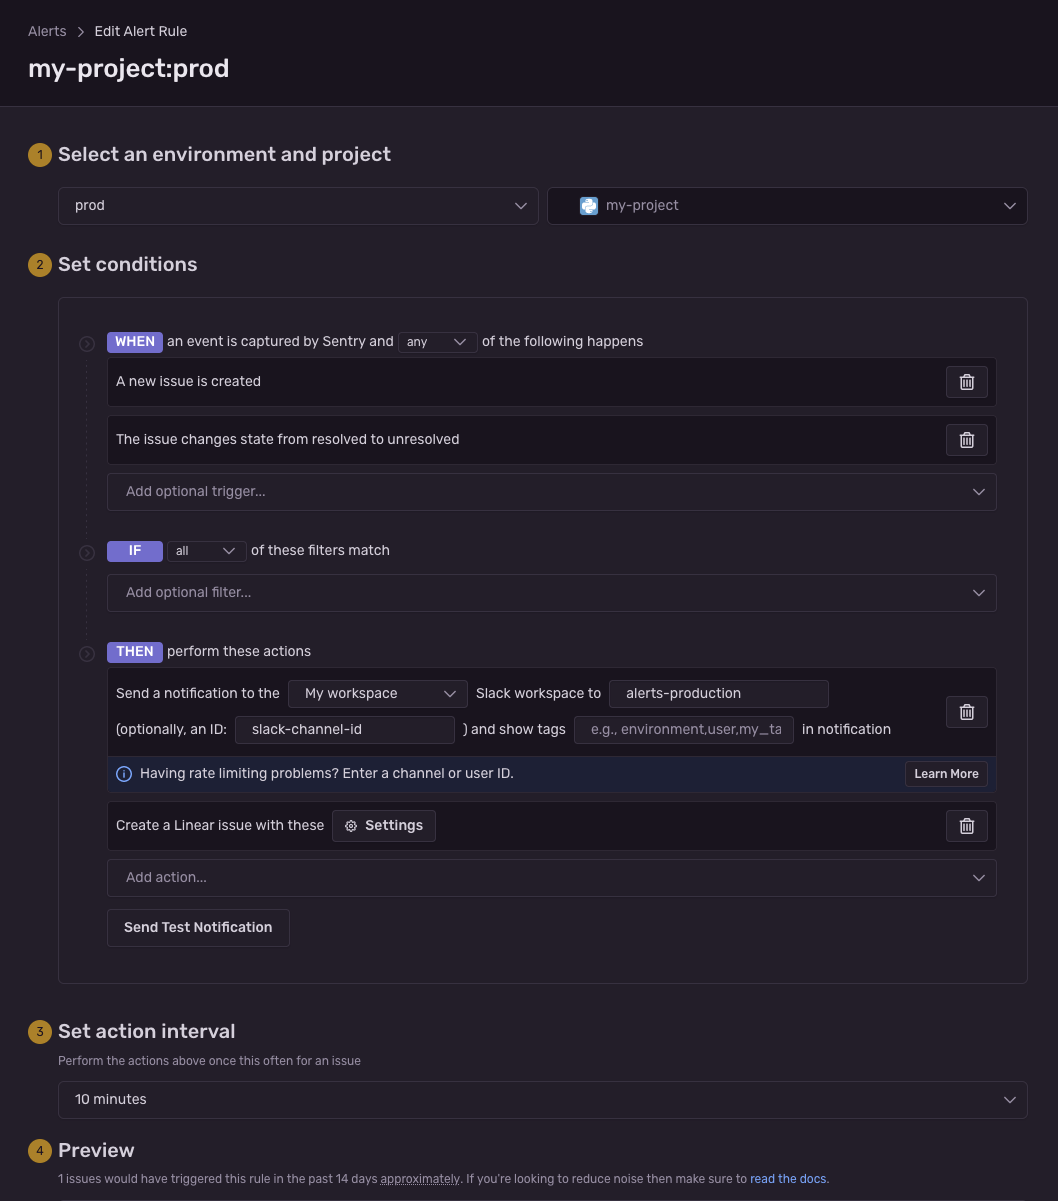
This way, every new or regression issue will trigger an alert. As you can see, setting it up in Sentry is really easy.
One obstacle you might encounter is when you have a microservices environment with plenty of Sentry projects. You need to set up those alerts on every single project separately, as Sentry does not allow you to have global rules. And as we all know, the number of microservices can grow rapidly.
What worked for me is to write a wrapper on top of the Sentry REST API and automate the process. This can be done as a part of your CI/CD.
For that purpose, I wrote a Python library called sentry-api-python, which should help you with this process.
Slack #
Slack is a great team collaboration tool. With its API, it’s also a great to integrate with. That’s something that we can use in our “Alerting & Monitoring” flow.
I suggest having a separate channel where all production problems can be found, and people can be notified. This is the place where the first conversations about severity and solutions for the problem start.
Here’s how an example of the message will look like: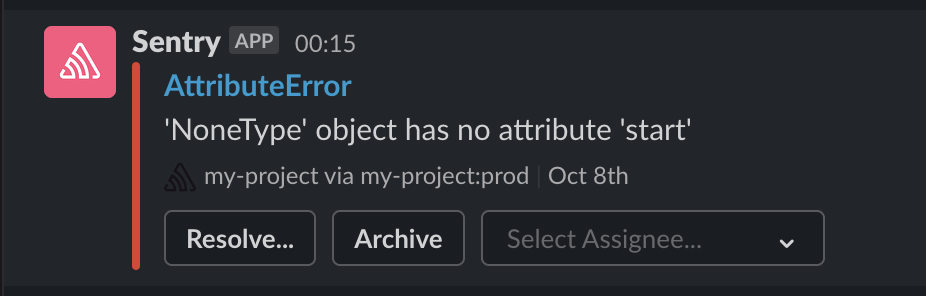
Linear #
I use Linear in the flow for multiple reasons:
- It acts as a bridge between Sentry and Squadcast.
- It provides a single place where you can prioritize issues (not all problems on production are equally important).
- It keeps track of historical issues for reporting.
- It makes it easier to share and be transparent with product owners and project managers for allocating people to fix those issues.
- It keeps track of the status of work for specified issues. Any change to the status of a ticket made in Linear is reflected in both Sentry and Squadcast.
Squadcast #
Last but not least, Squadcast. This is a relatively new tool for me, which looks super promising!
It allows you to gather alerts from different sources, and currently, they have more than 166 integrations available. What I really like about this tool is its “on-call” schedule module and flexible escalation policy.
With these two modules of Squadcast, you get a powerful tool that notifies your team about the platform’s health.
I could write a post on its own about Squadcast, so if you haven’t used or heard about it, I recommend checking it out.
Final Thoughts #
Every tool used in this flow can be replaced or removed. In fact, you could change the whole flow completely. But what’s important is to understand the tools you’re using and how you can connect them together to give your users/customers a better experience by being aware of your platform’s health and react quicker than your users do.
The End #
That’s it! Let’s keep your platform healthy :) If your company needs some help with Alerting & Monitoring, get in touch.